This post describes how to understand and interpret Sailing Results.
You probably own and boat and know it’s Portsmouth Yardstick. You probably know that a lower Portsmouth Yardstick number indicates a faster boat but do you know how to interpret Sailing Results when they are posted on the noticeboard at your local club?
We’re going to use some sailing results from a real race. It includes a LASER and SOLO. The current Portsmouth Yardstick numbers for a LASER and SOLO are 1095 and 1140 respectively. On paper a Laser is a much faster boat than a SOLO. In fact in the sailing results described below the LASER is over the finish first but as you’ll see in the results the SOLO actually wins the series. I’ve picked these as I regularly get beaten by SOLOs at my local club!
Take a look at Portsmouth Yardstick – what is it for a detailed explanation of how this is applied to a race result.
Understanding Sailing Results
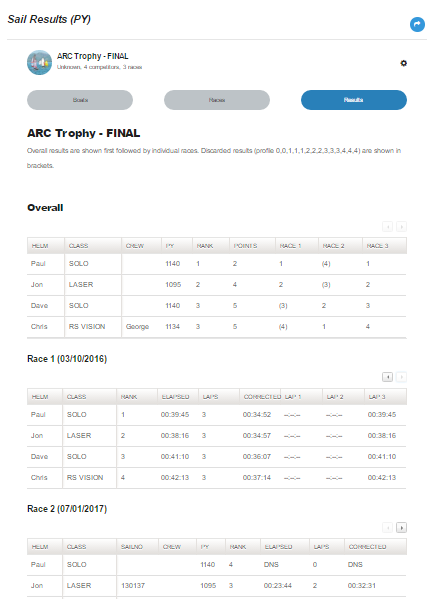
Lets start with a typical set of race results from SailResults. I’ve deliberately generated this on a large screen device. This means we can see more of the results in one go making things a little easier.
Tip: Remember that you can view race results at any point during a race! The results are recalculated every time you show the Results screen.
I still haven’t managed to fit all 3 races on…
 Tip: Don’t forget the arrows at the top of each of the tables. These allow you to scroll right through the table. Not all columns fit on all devices. So get scrolling!
The Overall Results
This is ordered by rank. The winner of the overall series should be at the top.
Each row also shows the accumulated points (lowest is best) followed by the points allocated for each race. (again lowest is best) Entries in brackets are discards. See Applying a Discard Profile to Sailing Series Results to understand discarded results.
The points allocated for a race are actually the boat’s rank for the particular race. Boats that don’t sail a race are allocated a ‘last place’ ranking.
Individual Race Results
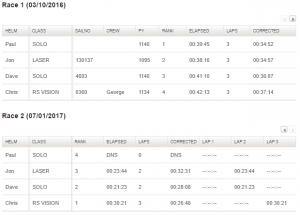
Here’s a better picture of 2 of the race results from our series. I’ve clicked the scroll arrow in the second race so that the individual lap times are visible.
 So there are some items to point out.
Firstly, I didn’t enter each individual lap time. I was being lazy, I simply entered the time for each boat as they finished. Secondly, you’ll notice that some boats completed more laps than others in Race 2. This often happens! Toppers, for example, sail a lot slower than Lasers! SailResults will average results according to the rules.
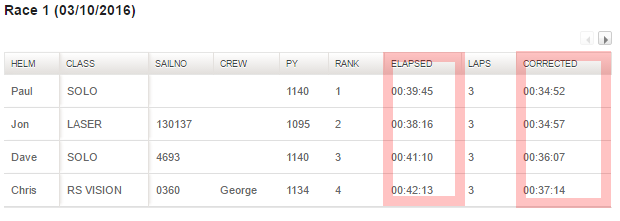
Here’ a better view of the results from Race 1. I’ve highlighted in red the important columns.
Elapsed – this is the real amount of time the boat took to complete their laps
Corrected – is the corrected time after applying the boat’s PY Number. See this post about Portsmouth Yardstick numbers and how they are applied!
Boats are allocated a ranking based on their corrected time.
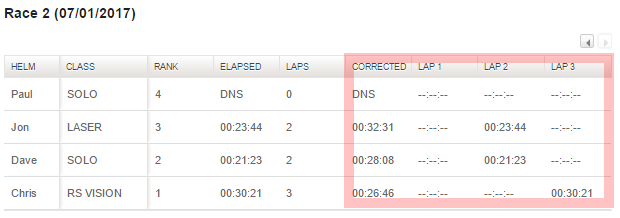
Here’s a closeup view of Race 2. I’ve scrolled to the right on the table so that the times at each lap can be seen.
Note that Paul in the Solo did not start this race ‘DNS’. He is therefore allocated a rank of 4th for this race.

